Need help setting up snorkel?
Please send an email to okay.zed at gmail and I'll be more than glad
to help you get setup with an instance and answer any questions about your
use case and requirements.
Happy snorkeling!
Instrumentation and analysis of user behavior via sequenced bi-grams
QUESTION
“I have a feature-rich web site or app - how do I understand the behavior of my clients?”
“How can I dig into my clients behavior in a more detailed manner than clicks?”
SUMMARY & BACKGROUND
We will go over using bi-grams to analyze user behavior in client heavy apps and what questions they can answer in practice.
In the old webbe, web analytics were built around server based requests and their referrer links. In server centric systems, understanding user behavior is a matter of piecing together and understanding the server requests as URL bi-grams: previous URL and the current URL.
In modern websites and apps, though, functionality and features have been created that exist solely on the client. While it’s still possible to analyze what is happening via server requests (usually the client app makes use of API endpoints), the context and meaning of actions will often be lost when translated into an XHR request.
On this page we will discuss the usage and benefits of bi-grams for manual instrumentation and how to expose meaningful frequency and duration metrics for per-team and global consumption.
INSTRUMENTATION
Imagine an instrumentation library that has the following API:
function recordEvent(feature_name, event_name)
Traditionally, the above API would emit single event records that will be aggregated and/or stitched together on the server. We will explore the advantages of using bi-grams (two events per record, prev and current) to instrument user behavior, instead.
In our instrumentation API, every recordEvent call will emit two records: a
feature-specific event record and an optional global event record. The
feature specific events dataset captures the flow of activity within a
given feature, while the global events dataset captures the flow of
activity on the whole site.
The following records will be emitted to log the activity within a given feature and between features:
// feature specific event record
{
  route: "<ROUTE>",
  context: "<CONTEXT>",
  dataset: "feature_events",

  event: "<EVENT>",
  feature: "<FEATURE>",
  prev_event: "...",

  // auto inserted
  action_id: 12,
  timestamp: "<NOW>",
  delta_ms: 120 // time since last event
}
// optional global event record
{
route: "<ROUTE>",
context: "<CONTEXT>",
dataset: "global_events",
event: "<EVENT>",
prev_event: "...",
feature: "<FEATURE>",
prev_feature: "...",
// auto inserted
action_id: 2,
timestamp: "<NOW>",
delta_ms: 120 // time since last event
}Notice the feature specific record contains two fields prev_event / current event. we will use these two fields as a bi-gram. Similarly, the global record now contains two bi-grams: prev_event / current event and prev_feature / current feature.
EXAMPLE SESSION
Using our API, we add manual instrumentation calls inside our application at page load and other key points (f.e. interaction with notifications, chat, news feed, photo viewer, etc)
setPage("/home")
setContext("newsfeed")
recordEvent("activity", "active")
recordEvent("notifications", "click")
recordEvent("notifications", "show")
recordEvent("photo", "popup")
recordEvent("notifications", "hide")
recordEvent("activity", "idle")
recordEvent("chat", "receive_message")
recordEvent("activity", "active")
setContext("chat")
recordEvent("chat", "send_message")
recordEvent("chat", "send_message")
recordEvent("chat", "receive_message")
setContext("newsfeed")
...
QUERIES
Using the API above and the resulting bi-gram records, we can ask and answer questions about event frequency, flows and duration, as well as feature popularity and co-usage by querying the Feature Specific Events (FSE) table and the Global Events (GE) table
EVENT QUERIES
We use event frequency to measure how users navigate our website and determine what features are most prominently used. To do so, we issue a query on the FSE (feature specific event) dataset to retrieve the most popular events and their features
SELECT
COUNT(1)
FROM FSE
WHERE timestamp > TIME("-1 day") and timestamp < NOW
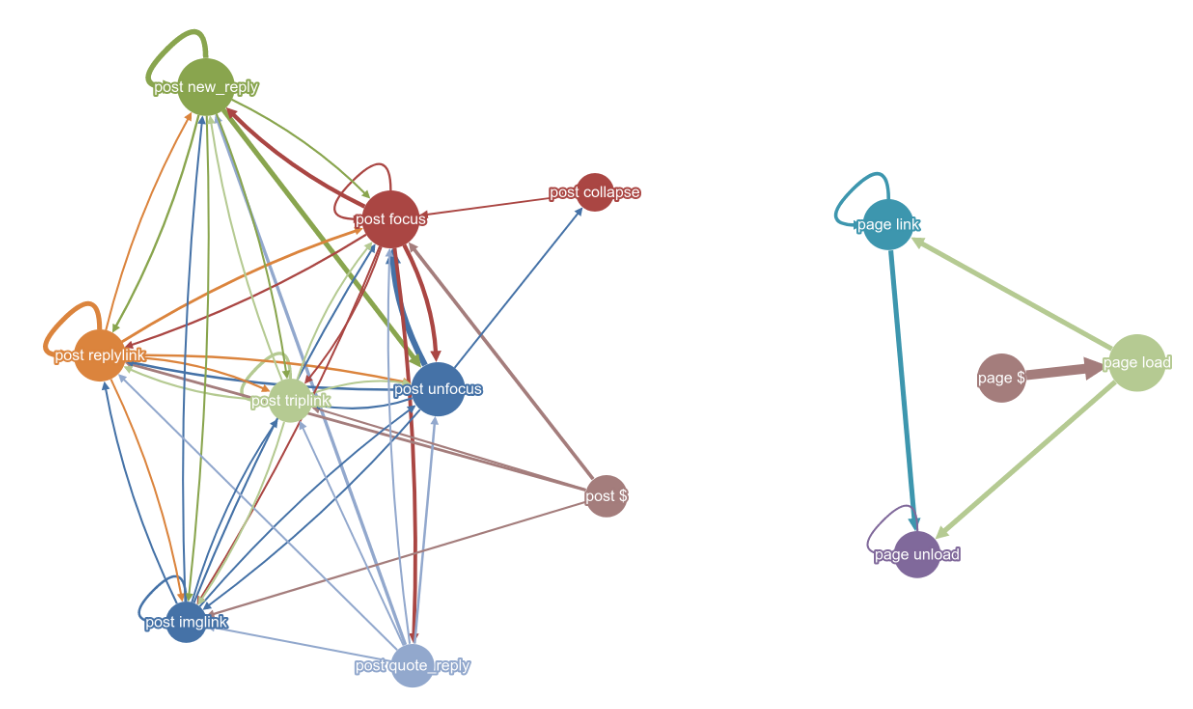
GROUP BY event, featureTo describe event flow or how clients interact with a specific feature, we can use our bi-grams to create a markov chain model describing the interaction frequencies of events within a given feature flow.
SELECT
  COUNT(1)
  FROM FSE
  WHERE timestamp > TIME("-1 day") and timestamp < NOW
  GROUP BY event, prev_event, feature
EVENT DURATION
To describe duration between events (for example, we are instrumenting how long
a modal dialog is displayed for), we would add two instrumentation calls:
recordEvent("popover_duration", "show") and recordEvent("popover_duration",
"hide") to record the appropriate events and their durations.
We then query for the show:hide event bigram and the delta_ms to show how long the popover is open for.
SELECT
  COUNT(1)
  AVG(delta_ms)
  FROM FSE
  WHERE timestamp > TIME("-1 day") and timestamp < NOW
  GROUP BY event, prev_event, feature
FEATURE QUERIES
To understand feature popularity, we will take the count of different features within the GE dataset. We can then validate our numbers against the same fields from the FSE dataset
SELECT
  COUNT(1)
  FROM GE
  WHERE timestamp > TIME("-1 day") and timestamp < NOW
  GROUP BY feature
SELECT
COUNT(1)
FROM FSE
WHERE timestamp > TIME("-1 day") and timestamp < NOW
GROUP BY featureTo determine feature co-existence or how often features are used together, we use our feature bi-grams and their frequency counts to describe the relative popularity of features.
SELECT
  COUNT(1)
  FROM GE
  WHERE timestamp > TIME("-1 day") and timestamp < NOW
  GROUP BY feature, prev_feature
WEAKNESS
Using bi-grams has drawbacks as well:
1) A client-side instrumentation library is not guaranteed to capture all behavior the same way a URL processing library will. Its possible the page loads, some actions happen and the client leaves the site before there is any chance to log what happened. Similarly, it’s possible the last actions on a site might go missing as the client powers down their device or browser.
2) Adding a new event into a feature flow can have unknown global effects. For example, if we have the event flow A -> B -> C and introduce a new event, Z, that always occurs before B, we can ruin any previous monitoring that is being done on A -> B. Similarly, deleting a previously monitored event can have unintended consequences. Being careful about what is allowed into the global event log and enforcing the usage of feature namespaces can help with this problem
3) Certain types of analysis are not possible using only bi-grams. For example, conversion flows or user segmentation may not be immediately answerable by only looking at aggregate queries: they might require a data analyst writing custom queries or code. The good news is that the same datasets can be used for this code and provide more information than just server URLs.
4) Validating instrumentation is not easy. When there are millions of users and interactions, getting an accurate picture of how people navigate the site becomes more and more difficult, as there is no “average” navigation.
CHANGELOG
2016-06-20
- add weakness section, general read through
2016-06-07
- start removing headers, trying to make it readable
2016-06-05
- add instrumentation example
- add records / GSE & FE datasets
- add example queries
2016-06-03
- starting write up of n-gram analysis